A couple of months ago we hit a big milestone — LiveChat reached 20k customers for the first time ever.
A month or so before that happened, we held a small company-wide competition. The goal was to guesstimate when the 20k would happen.
We had 70 people trying different things, from making semi-random picks to using popular analytical models.
I went with Prophet — a prediction tool from Facebook.
What is Facebook Prophet and why it made sense to use it
Prophet is an open source forecasting procedure for Python and R. You can use it to make predictions for time series data.
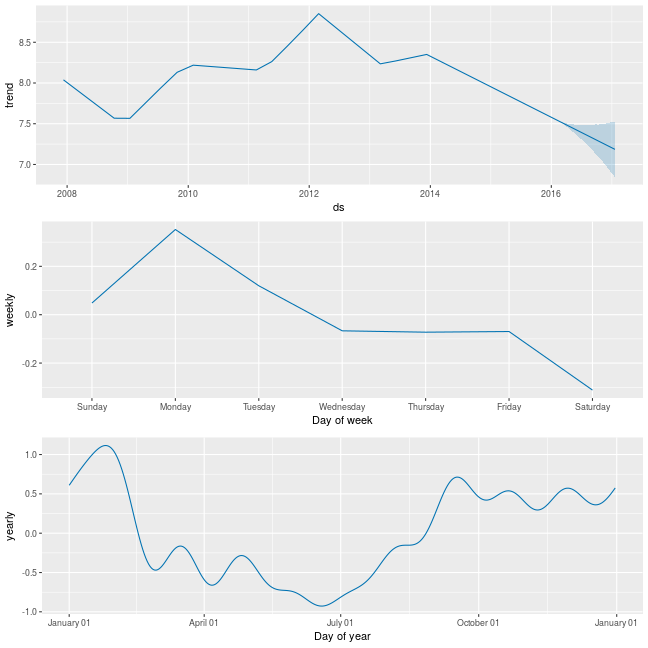
It handles well the data affected by seasonality and various holidays. This made Prophet a perfect fit for me since LiveChat is affected by seasonality a fair bit (think slower growth during summer and booming growth before and during the Holiday shopping season).
 Sample Prophet charts (source: Prophet)
Additionally, I already had some previous experience with R from working on our annual customer service report. It turned out to be more than enough since Prophet is pretty straightforward.
Throwing data at the model
In my prediction, I used 5 years’ worth of data. Why this specific number? This is the farthest I could go back where the data looked fairly similar.
I didn’t want to feed the model with any data that changed only because we tweaked our ‘optics’ a bit and modified the way we calculate certain metrics. This could lead to wrong conclusions as the model would try to incorporate the ‘optics’ change into the trend.
Installing Prophet is easy. In R, this will be:
install.packages('prophet’)Once you have it installed, you need to load the data as log numbers:
df % mutate((y = log(y)))Next up, you need to run a function to create a model for your data:
m < -prophet(df)After the model is complete, you need to make future predictions using the make_future_dataframe function (you can use periods argument to specify the number of days):
future < -make_future_dataframe(m, (periods = 100))Now you’re finally ready to make your forecast using predict function. Pass to it the model and the future predictions as arguments:
forecast < -predict(m, future)As a result, you get an object with yhat column, which gives you an estimate for each day of the specified time-frame.
Multiply the log number by e and you’ll get the result!
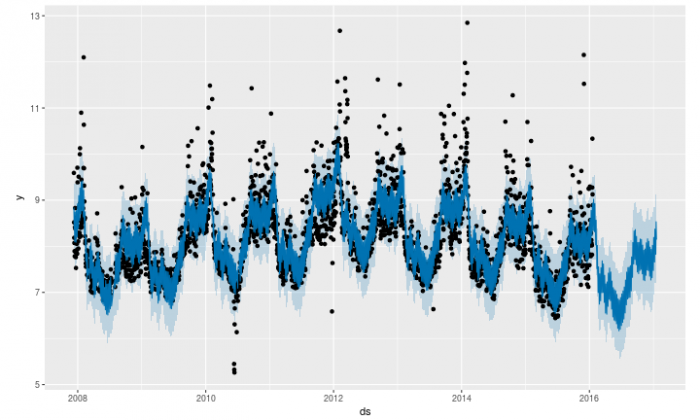
 A sample Prophet chart (source: Prophet)
I strongly encourage checking out the full project documentation.
After running Prophet with my data, I got the result as a series of logarithms. After finding the right number, I extracted the date and cast my vote.
Did I get it right? Well, almost.
I missed the mark by one day. One big spike mid-week set the number of customers at exactly 20k a day before my pick.
What I learned from missing the mark by one day
It may seem a bit anticlimactic, but using Prophet was definitely fun and worth it.
Although I didn’t win the contest, the prediction model seemed fairly accurate. Using the historical data, it was able to predict almost exactly when we’d hit 20k customers.
I even got to learn when we’d hit 30k customers (if the model got it right). Not going to disclose that in case there’s another competition!
On a more serious note, if you’re struggling with predictions in an industry that is highly volatile and/or affected by seasonality and holidays, you should definitely give Prophet a try.
Resources
If you want to learn more about Prophet and its use cases, check out the following:
- Facebook’s Prophet: Forecasting Stores Transactions
- Time Series Forecasting Using Facebook’s Prophet R Library
- Using Facebook Prophet Forecasting Library to Predict the Weather
Good luck forecasting!